February 24, 2015
WB Lift Monitor with Kibana and ElasticSearch
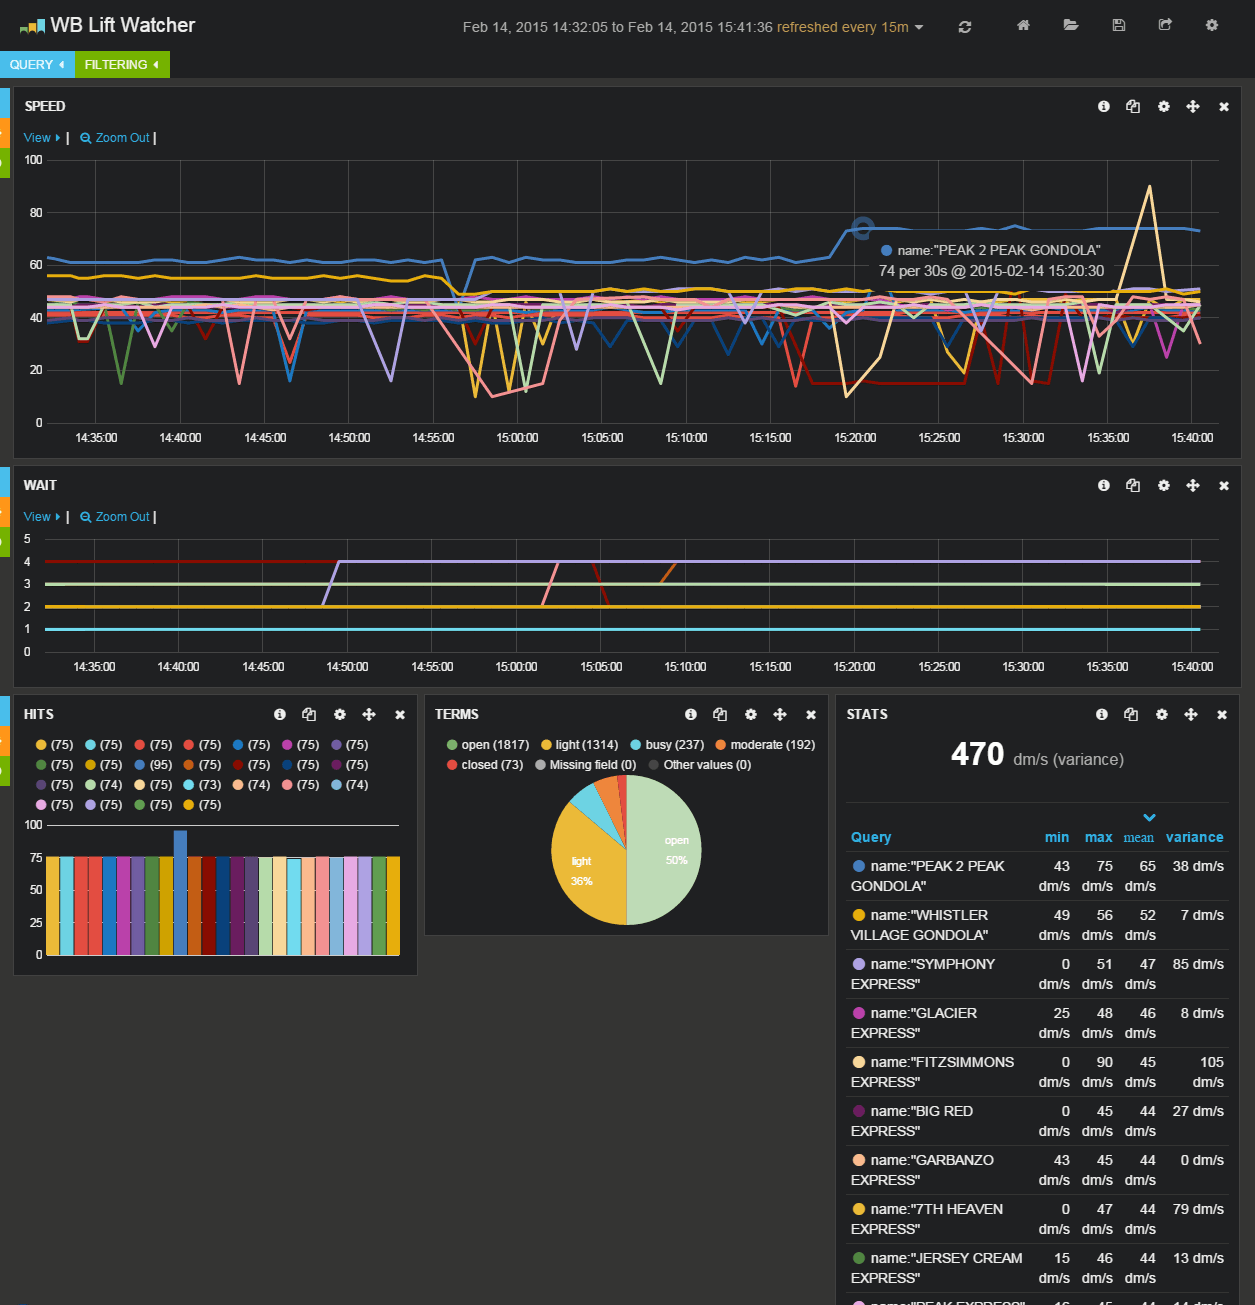
I decided to try loading data from https://secure.whistlerblackcomb.com/ls/lifts.aspx into ElasticSearch, and view it in Kibana 3 for fun. nodejs handles downloading the info and putting it into ElasticSearch, and runs Express to serve the static Kibana pages. You can launch your own instance on Heroku with this button:

Stuff I learned making this
Kibana isn’t great for this purpose
Overlapping lines on graphs hide data. Users can’t tell exactly which lifts are closed by looking at the graphs because the last queried lift covers up the other lines at the same Y value.
Kibana rounds numbers to whole numbers, so the speed graph/histogram loses precision. Combine that with the overlapping lines mentioned above, and the graph becomes less useful. I had to multiply speeds by 10 before loading them into ElasticSearch (speeds are in dm/s instead of m/s), otherwise all the lifts appear only have about 4 different speeds in the graph.
Still, looking at the colourful squiggly lines is fun during opening and closing time on weekends.
Line breaks are weird
The hardest part of this was making .profile.d/kibana-config.sh work. I kept running into issues with line breaks ending up in the login:password string that gets base 64 encoded and used in the Authorize HTTP header, which lead to lots of 401 Forbidden errors when Kibana tried to access ElasticSearch.
Some bash commands
curl -X DELETE 'https://name:password@server-name.bonsai.io/index-name'

curl -X POST 'https://name:password@server-name.bonsai.io/index-name'
These work great together to remove and recreate an index. Very handy when you to clear data out of 1 ElasticSearch index.
BONSAI_URL=https://name:password@server-name.bonsai.io npm start
When working on my dev machine, I used this to start node with the same BONSAI_URL environment variable set that Heroku has.
Heroku is fun
How cool is this button?
Things to note when you deploy this:
- The default time range in the Kibana dashboard is 6 hours, so it takes ~15 minutes to save enough data for the graphs to populate.
- If this runs on a free dyno, the process that scrapes data and serves Kibana will sleep if it doesn’t receive any HTTP requests, and no data will be scraped. No data means blank spots in the graphs. You can refresh the page with the browser’s refresh button (not Kibana’s refresh button, which only makes a request to the ElasticSearch server), or set up another service to ping the app’s URL occasionally to stop the process from sleeping.
Other stuff to add?
Better colours for queries
This gradient scale might be fun. Valley lifts in green, mid-mountain in white, alpine in blue.
Maybe Whistler and Blackcomb lifts could have slightly different tints?
